PyBMRB quick start
Installation
PyBMR is available in the Python Package Index (PyPI), which can be installed easily using the following command
pip install pybmrb
Input
PyBMR is designed to fetch the data directly from BMRB for all its visualization involving BMRB data. However, optionally NMR-STAR files with chemical shift information or a simple csv file(peak list) with two columns can also be used as an input. All that You need know is just the BMRB entry IDs and the IUPAC names for the residue/atom of your interest.
Parameters
Here is the list of some useful parameters. Full list of parameters are documented in the Modules documentation page.
bmrb_ids either single BMRB id or list of BMRB IDs as a list; example bmrb_ids = 15060 or bmrb_is = [17074, 17076, 17077]
input_file_names local NMR-STAR file or list of files with full path; example input_file_names = ‘test/test_data/mydata1.str’ or input_file_names=[‘test/test_data/mydata1.str’, ‘test/test_data/mydata2.str’]
For chemical shift histograms, you need to know the three letter code for the amino acid and its IUPAC atom name
residue three letter code or two letter nucleic acid code; example residue = ‘ALA’ or residue = [‘ALA’, ‘GLY’, ‘PHE’]
atom atom name in IUPAC format and it supports wildcard ; example atom=’HD21’ or atom = ‘HD’ or *atom=[‘CG’, ‘C’, ‘CG’]
list_of_atoms you may also provide as list of atom as follows ; example list_of_atoms = [‘TYR-CB’, ‘VAL-CB’]
Optional
You may customize the visualization using some of the optional parameters
auth_tag BMRB entries and NMR-STAR files may contain two sets of sequence numbering. One is the standard numbering staring from 1 stored in Comp_index_ID and the other is the author provided sequence stored in Auth_seq_id. By default it uses the sequence from Comp_index_ID. If you want to use author provided sequence numbering the make this true; example auth_tag=True
legend Showing the legend for spectra simulation is disabled by default. If uses shapes to distinguish data sets and colors to distinguish residue type. Showing this combination in legends is exhaustive. However you may chose one to show as the legend. example legend=’dataset’ or legend=’residue’
draw_trace While comparing multiple entries or comparing BMRB entreis with your local NMR-STAR files, you may chose to trace the changes in peak positions for matching residues in the sequence. This will connect the peaks from the corresponding residues from different data set using a line. example draw_trace=True
peak_list Optionally you may also provide peak list as a simple csv file to plot with any BMRB entry or your local NMR-STAR files. The difference is NMR-STAR files contain assigned chemical shifts, while the peak list is just a list of peak positions in two columns. example peak_list=’/test/peak_list1.csv’
for chemical shift histograms, you may plot either count/percent/probability/probability density.If don’t specify anything the default would be count
histnorm normalization method ‘percent’ (or) ‘probability’(or) ‘probability density’
Output format
All spectra and histograms automatically open on your browser as an interactive visualization. If you wish to store them as interactive visualization, then you may write out as html file. If you want save them as static image, then you may chose ‘jpg’ or ‘png’ or ‘pdf’ or ‘webp’.
show_visualization If you don’t want the visualization open autpmatically, then you may disable this feature by setting this flag False. example show_visualization=False
output_file Specify your output file name here with full path. File extensions are automatically added(if not specified) based on the output format type. example output_file=’output_path/myplot’
output_format Supported formats html,jpg,png,pdf and webp. example output_format=’pdf’
output_image_width Specify the width of the image; default 800. example *output_image_width = 1200
output_image_height Specify the height of the image; default 600. example *output_image_width = 800
Quick start
First, pull up an interactive python session and import the package:
from pybmrb import Spectra, Histogram
View BMRB entry or NMR-STAR file as spectra
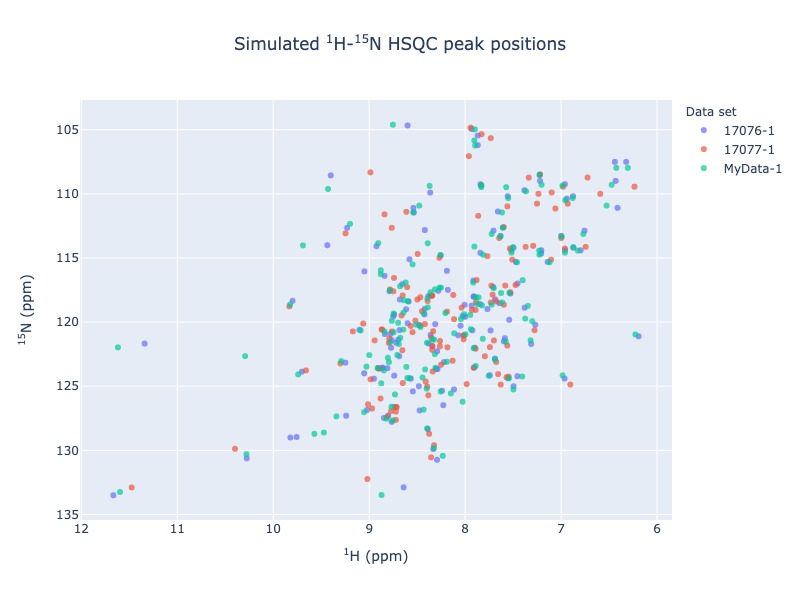
Suppose you are working with a protein called arsenate reductase and you have your data in a NMR-STAR format. You found out that there are already two arsenate reductase entries (17076,17077) in the BMRB. You may now easily compare your data with BMRB as overlying 1 H - 15 N - HSQC spectra using the following command
peak_list = Spectra.n15hsqc(bmrb_ids=[17076,17077], input_file_names='tests/test_data/MyData.str', legend='dataset')
This will open the visualization on your default web browser. When you mouseover the tool-tip it will show the information about each peak. You may turn on and off the data set using legend on the right. Click here to view the output1
If you want the output as an image and not to open the visualization on web browser then use the following option
peak_list = Spectra.n15hsqc(bmrb_ids=[17076,17077], input_file_names='tests/test_data/MyData.str', legend='dataset', output_format='jpg', output_file='n15hsqc_compare.jpg', show_visualization = False)
Comparing of local data with BMRB entries
The command will output the peak list information to the variable peak_list.
If you want to trace the chemical shift changes, use the following command
peak_list = Spectra.n15hsqc(bmrb_ids=[17076,17077], input_file_names='tests/test_data/MyData.str', legend='dataset', draw_trace = True)
Click here to view the output2
If you don’t have your data in NMR-STAR format, then no problem!. You may extract the peak list from any NMR spectra as a csv file. You may use the csv file to compare your peak list with any BMRB entry
peak_list = Spectra.n15hsqc(bmrb_ids=[17076,17077], peak_list='tests/test_data/test_peak_list.csv', legend='dataset', draw_trace = True)
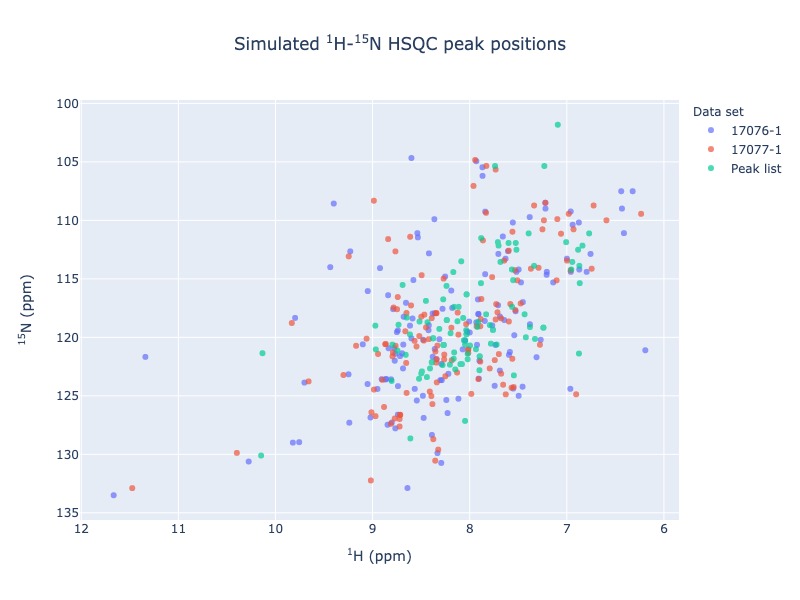
Comparing of peak list with BMRB entries
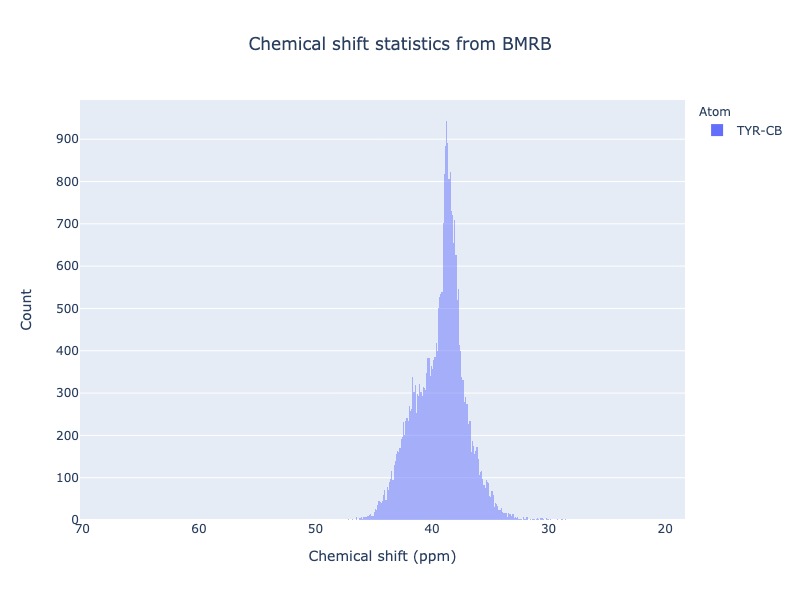
Chemical shift statistics
You may easily generate chemical shift histogram of any atom or list of atoms or any residue with single command.
cs_data = Histogram.hist(residue='TYR', atom='CB')
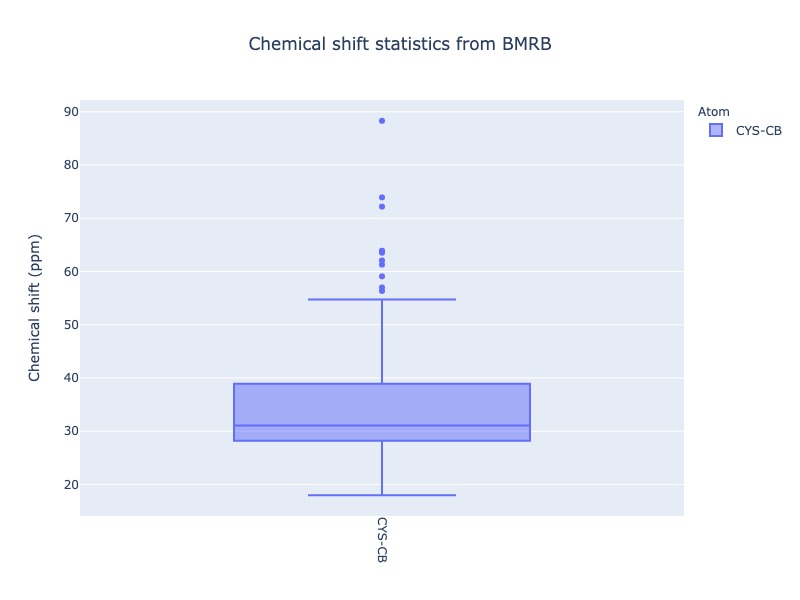
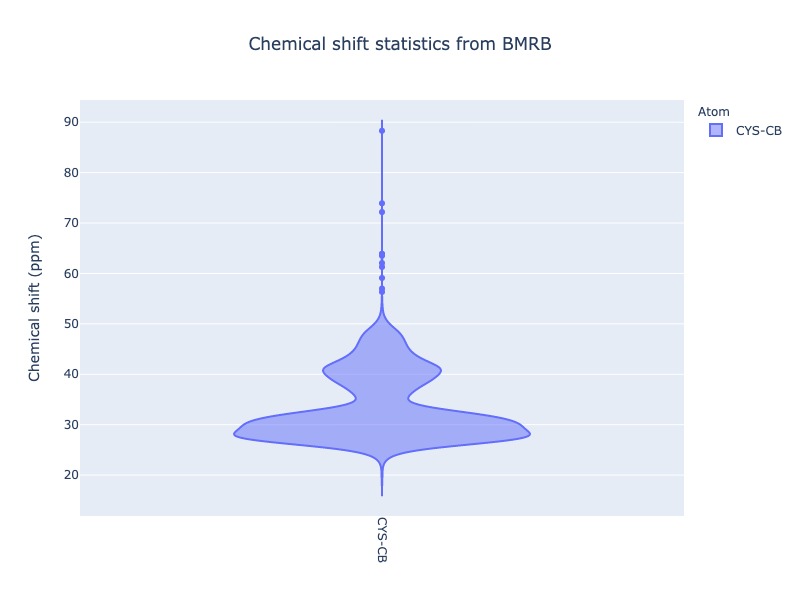
Different plot types (box, violin) are also supported. Click the figure caption for html version. When you mouseover the box and violin plots, it will show the statistical properties of the distribution
cs_data = Histogram.hist(residue='CYS', atom='CB',plot_type='box')
cs_data = Histogram.hist(residue='CYS', atom='CB',plot_type='violin')
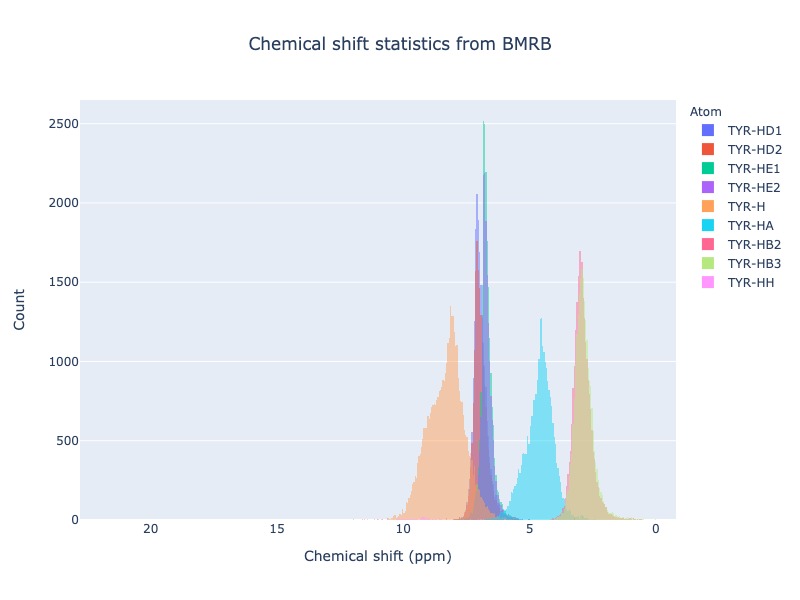
You may also use the wildcard
cs_data = Histogram.hist(residue='TYR', atom='H*')
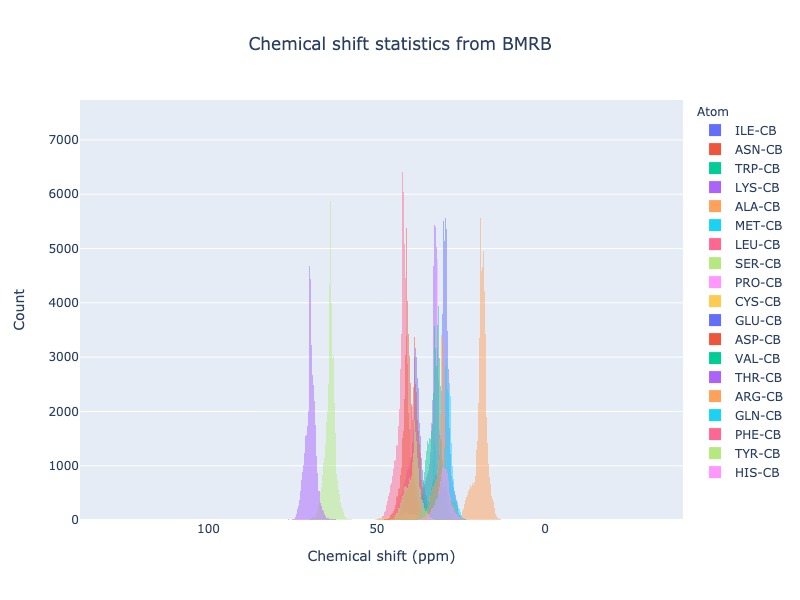
Leaving out the residue will plot CB chemical shift distribution of all 20 standard amino acids
cs_data = Histogram.hist( atom='CB')
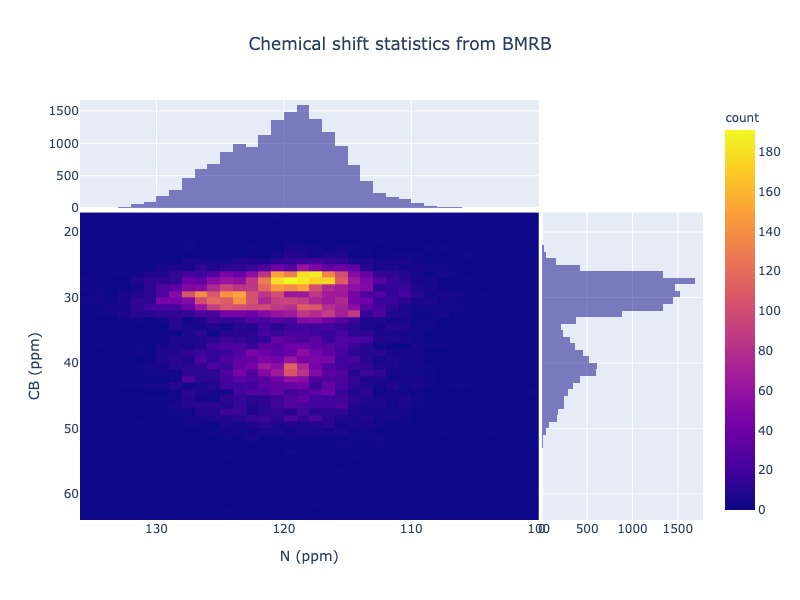
You may also plot 2D chemical shift correlation plot for two atoms in the same residue
cs_data = Histogram.hist2d(residue='CYS',atom1='N', atom2='CB')
More examples can be found Examples page.